
What are the Influenza Vaccine Risks?
A data-driven look at flu vaccine adverse events

What are the actual Influenza Vaccine risks? A data-driven look at flu vaccine adverse events
Federal safety databases document a range of side effects from annual influenza vaccination, from predictable and mild to rare and serious. Here is what the numbers show, what they mean for the policy debate over mandatory annual shots, and why the data sources themselves carry important caveats.
Whenever someone raises concerns about flu vaccine side effects, the response from official sources tends to follow a predictable script: the vaccine is safe and effective, serious side effects are extremely rare, and the benefits far outweigh the risks. All of that may be true in aggregate. But it tells you almost nothing useful about whether a specific person in a specific circumstance should receive a specific vaccine formulation.
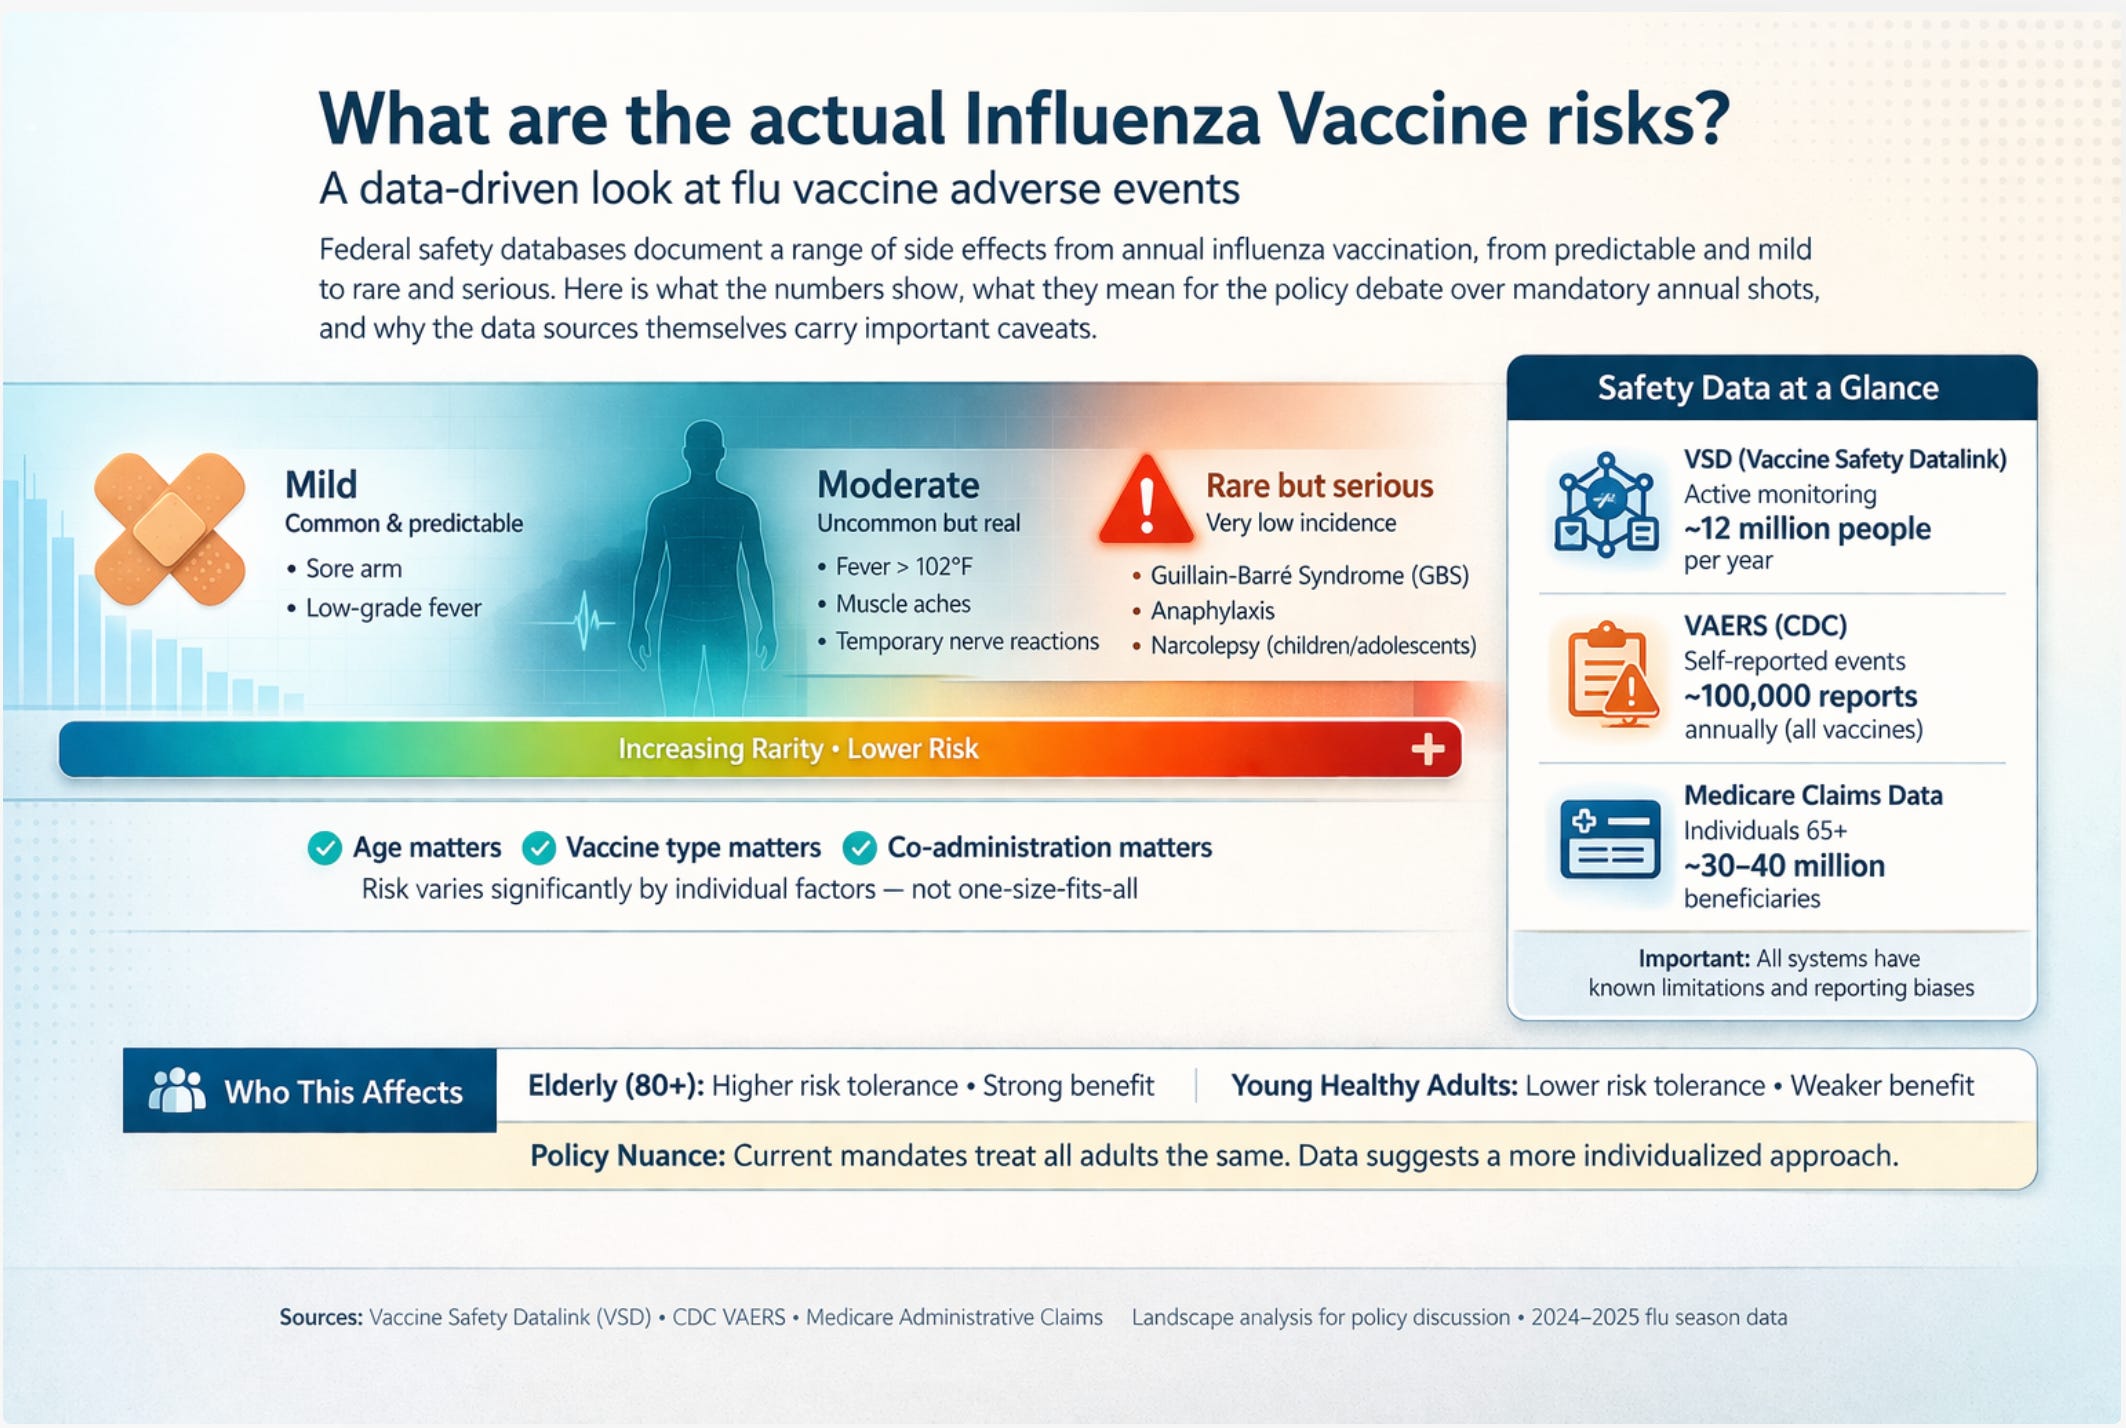
A detailed analysis of federal safety surveillance data, drawn from the Vaccine Safety Datalink (VSD), the Centers for Disease Control and Prevention’s (CDC) Vaccine Adverse Event Reporting System (VAERS), and Medicare administrative claims covering tens of millions of vaccine recipients, offers a more granular picture. The data reveal a risk profile that is neither alarming nor trivial. It is genuinely heterogeneous, varying significantly by age, vaccine formulation, co-administration with other vaccines, and the specific adverse event.
For the ongoing policy debate over mandatory or near-mandatory annual influenza vaccination, this heterogeneity matters enormously. A risk-benefit calculation that makes clear sense for a frail 82-year-old in a nursing home may look quite different for a healthy 28-year-old office worker. Current policy treats both identically. The data suggest that risk-benefit considerations warrant closer examination.
The routine side effects: what to expect
The most common adverse reactions to the flu vaccine are neither rare nor surprising. They reflect a functional immune response: the body recognizing a foreign antigen and mounting a reaction to it. Injection site pain, arm soreness, and mild fatigue are the signature experiences of the day or two following vaccination.
WHAT THE REACTOGENICITY DATA SHOW
Among healthy adults aged 18 to 49, approximately 30 to 60% report injection site pain, 14 to 16% report myalgia (muscle aches), and 1 to 2% experience a low-grade fever. Symptoms typically resolve within 48 hours.
The enhanced influenza vaccine formulations recommended for adults over 65 produce noticeably more local reactogenicity: high-dose vaccines (which contain four times the standard antigen load) generate injection site pain in 25 to 45% of recipients and myalgia in 15 to 20%, compared to 10 to 25% and 5 to 10% respectively for standard-dose formulations. MF59-adjuvanted vaccines show a similar pattern, with injection site pain in 30 to 50% of older recipients.
Critically, the higher reactogenicity of enhanced formulations in older adults is not associated with higher rates of serious adverse events. It reflects a stronger immune activation, which is precisely the goal.
One important and counterintuitive data point: older adults generally experience less reactogenicity than younger ones from the same standard-dose vaccine. This is not because the vaccine is gentler on their systems. It reflects immunosenescence, the age-related decline in immune function. The same diminished immune activation that produces fewer side effects also tends to produce weaker protective antibody responses. Low reactogenicity in older adults is not reassurance; it is a signal of blunted immune engagement.
For young children aged six months to two years, fever occurs in roughly 12% of vaccinations, and irritability is common. The rate is meaningfully higher when the flu shot is co-administered with other vaccines, particularly the 13-valent pneumococcal conjugate vaccine (PCV13) and the DTaP (diphtheria, tetanus, and acellular pertussis) combination shot. That interaction matters for the more serious adverse events discussed below.
Serious adverse events: parsing the signal from the noise
Four potential serious adverse events have attracted sustained attention in the scientific literature: anaphylaxis, Guillain-Barre syndrome, febrile seizures in young children, and transient ischemic attack. Each has a meaningfully different evidence base, and conflating them under the general label of “rare side effects” obscures important distinctions.
Table 1: Adverse event summary
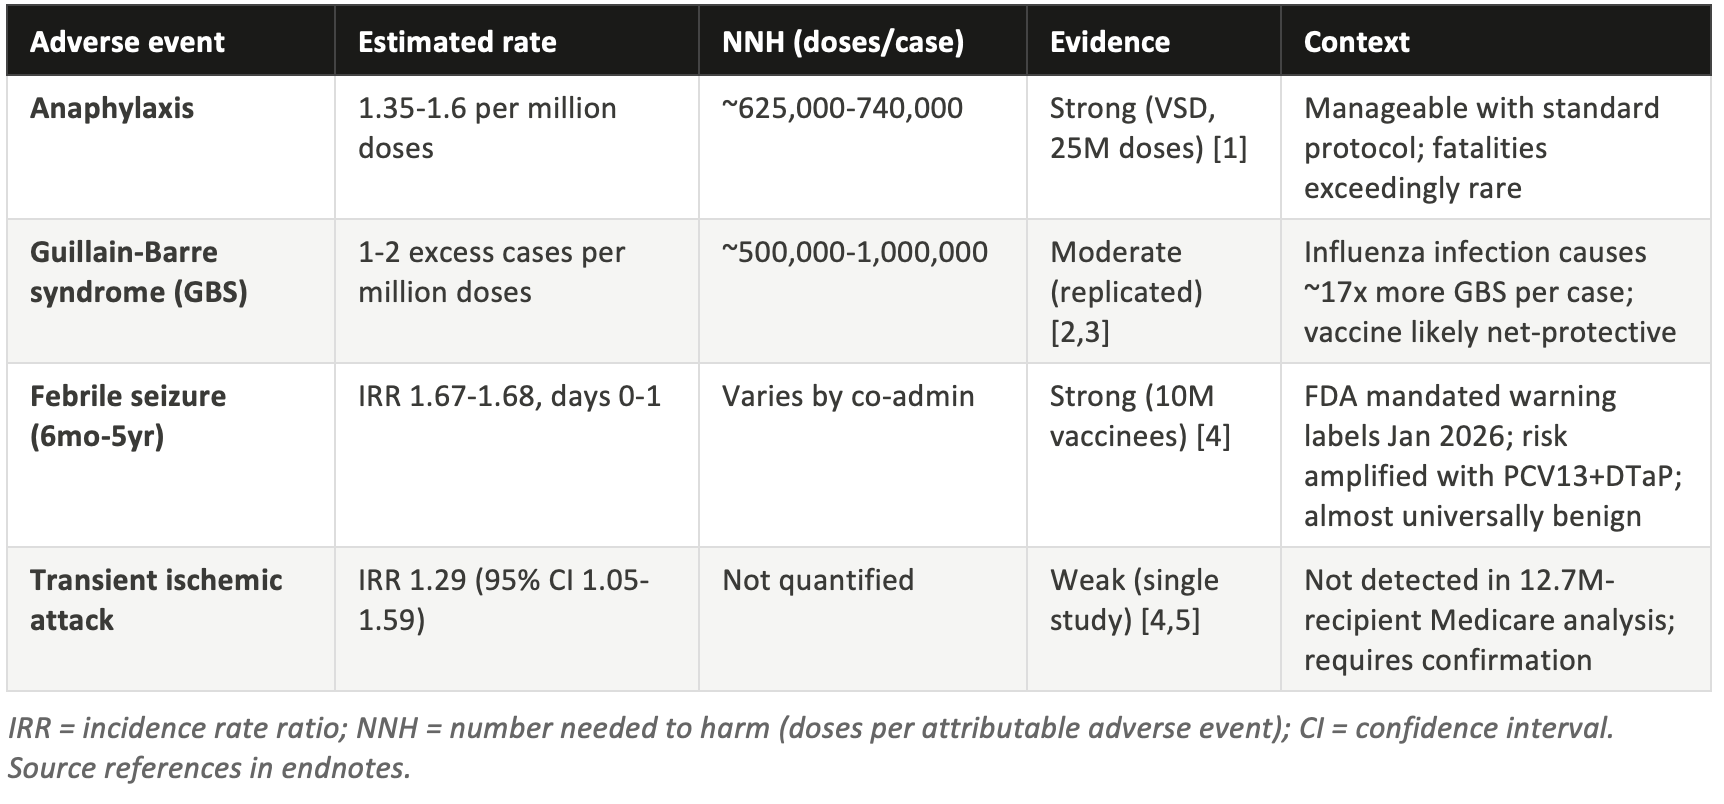
Anaphylaxis: real but rare
Anaphylaxis following flu vaccination is a genuine phenomenon, well-documented in the Vaccine Safety Datalink across 25 million doses. [1] The rate falls between 1.35 and 1.6 cases per million doses administered, yielding a number needed to harm (NNH) of roughly 625,000 to 740,000. That means you would need to vaccinate between 625,000 and 740,000 people to expect one case of anaphylaxis attributable to the vaccine.
VAERS data capture only about 13% of true anaphylaxis cases, which is why researchers rely on the VSD for incidence estimation rather than on passive surveillance. [8] The underreporting reflects the general limitations of voluntary adverse event reporting, not anything unusual about anaphylaxis detection.
Anaphylaxis is medically manageable when it occurs in a clinical setting with standard protocols in place, and fatalities are exceedingly rare. The event typically occurs within 15 to 30 minutes of vaccination, which is why post-vaccination observation periods are standard practice. For most vaccine recipients, anaphylaxis risk is negligible. For the small subset with known severe allergies to vaccine components, it warrants individualized clinical assessment.
Guillain-Barre syndrome: a complicated picture
Guillain-Barre syndrome (GBS) is a rare autoimmune condition causing progressive weakness and, in severe cases, paralysis. Its association with influenza vaccination was first identified definitively following the 1976 swine flu vaccination campaign, when roughly one additional GBS case per 100,000 doses was observed.
Modern seasonal flu vaccines show a much smaller signal: approximately one to two excess cases per million doses, yielding an NNH of 500,000 to one million. [2] The epidemiological relationship has been replicated across multiple seasons and in multiple countries, so the association is considered genuine rather than artifactual. [3]
THE COMPARISON THAT POLICY-MAKERS RARELY MENTION
Influenza infection itself causes Guillain-Barre syndrome at an estimated rate of 17.2 cases per million influenza cases, roughly 17 times the attributable excess from vaccination. In a season where the vaccine prevents substantial influenza illness, it almost certainly prevents more GBS cases than it causes. The vaccine is likely net-protective against GBS in most years.
The exception would be a mismatched season with very low vaccine effectiveness, where few cases of influenza are actually prevented. In those years, the benefit calculation shifts toward the adverse event side of the ledger, though even then the GBS risk from vaccination remains very small in absolute terms.
GBS risk from flu vaccination appears to be specific to adult recipients. It has not been identified as a statistically significant concern in pediatric populations. Among adults, it is not uniformly distributed: prior history of GBS is considered a precaution by the CDC, though not an absolute contraindication, reflecting uncertainty about whether vaccination triggers recurrence at elevated rates.
Febrile seizures in children: the 2026 warning label story
The most significant recent development in flu vaccine safety monitoring came in January 2026, when the Food and Drug Administration (FDA) issued mandatory updated warning labels to all six influenza vaccine manufacturers. The trigger was a study published that month analyzing approximately ten million pediatric vaccine recipients during the 2023-24 season. [4] The study found an incidence rate ratio of 1.67 to 1.68 for febrile seizures in children aged six months to five years during the day of and the day after flu vaccination.
An IRR of 1.67 means that febrile seizures occurred 67% more frequently in the two-day post-vaccination window than in control periods, a statistically robust finding at that sample size. This is not a new concern; elevated febrile seizure rates following flu vaccination in young children have been detected in prior surveillance cycles. The 2023-24 analysis was notable for its size and precision.
IMPORTANT CONTEXT ON FEBRILE SEIZURES
Febrile seizures in young children are frightening to witness but are almost universally benign. Current data indicates that they do not cause brain damage, do not significantly increase the risk of epilepsy, and typically resolve within a few minutes. The elevated risk in the post-vaccination window is real, but the baseline rate of febrile seizures is low, so the absolute excess risk remains small.
The risk is meaningfully amplified when the flu vaccine is co-administered with both PCV13 and DTaP on the same visit. Parents who are concerned about this risk can discuss staggered administration timing with their child’s pediatrician. The FDA warning labels now require disclosure of this interaction.
Unbiased studies that more rigorously examine the risks of vaccine-induced febrile seizures and other inflammatory risks to brain development associated with infant vaccination at various ages including cumulative adjuvant dose risk are needed.
The January 2026 label update is worth noting as a marker of how post-market surveillance is supposed to work: a signal is detected in passive surveillance, confirmed in a large-scale active surveillance study, and translated into updated prescribing information. The system identified an elevated risk, and regulatory action followed.
Transient ischemic attack: a signal in need of replication
A 2023-24 self-controlled case series analysis found a statistically significant IRR (estimated incidence rate ratio) of 1.29 (95% confidence interval [CI]: 1.05 to 1.59) for transient ischemic attack in the 21 days following flu vaccination. [4] The study was conducted in a commercially insured population and represents, to date, the primary source of this specific concern.
The finding has not been replicated. Concurrent analysis of 12.7 million Medicare recipients for the same season found no significant excess transient ischemic attack (TIA) risk, nor any significant signal for stroke, encephalitis, or transverse myelitis. [5] The discrepancy between studies is unexplained and has not been resolved in the subsequent literature.
Standard epidemiological practice requires replication before a signal is acted upon, and in this case the more powerful Medicare study found nothing. The TIA finding warrants monitoring and investigation, but it does not currently represent a demonstrated adverse effect.
The comparison that reframes the debate: NNV versus NNH
Adverse event rates in isolation are difficult to interpret. The relevant question for any vaccine policy is how the risk of harm from the vaccine compares to the risk of harm from the disease it prevents. The standard metric for this comparison is the ratio of the number needed to vaccinate to prevent one outcome (NNV) against the number needed to harm to cause one adverse event (NNH). [12] NNV and NNH calculations use a simple formula: NNV = 1 / (baseline event rate x vaccine effectiveness [VE]). Because the adverse event rate is fixed regardless of season type, the NNH does not change when VE falls. The NNV does, and that asymmetry is the core of the mismatch season problem.
Table 2: NNV to prevent one hospitalization, by age and season type
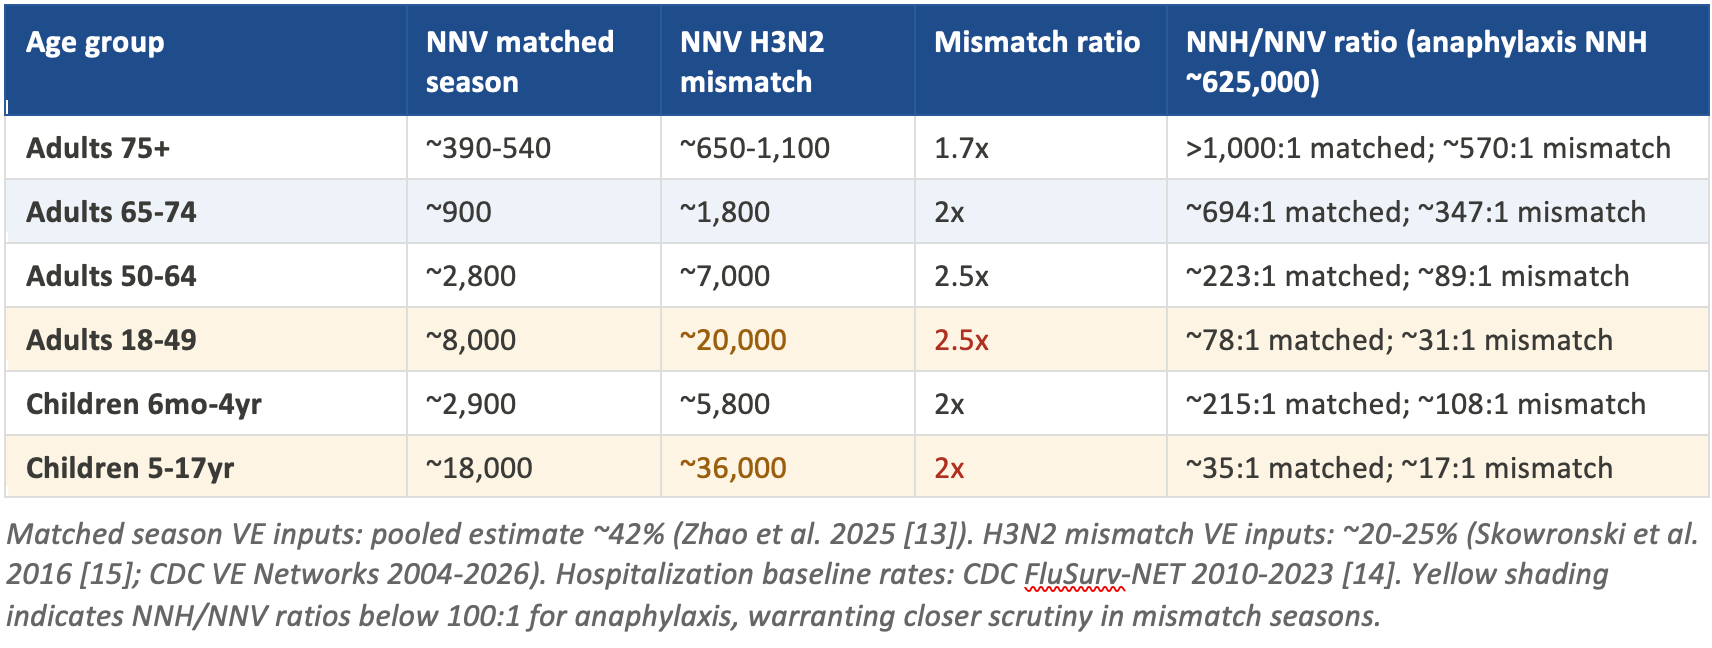
For adults over 75, the NNV to prevent one hospitalization in a well-matched season is approximately 390 to 540. [13] Even in a mismatched H3N2 season, where effectiveness against the dominant strain falls to 20-25%, the NNV rises only to 650 to 1,100. Against an anaphylaxis NNH of roughly 625,000, the ratio remains above 570 to 1. This group derives robust benefit in essentially all season types, and the risk-benefit case for vaccination is unambiguous.
Adults 65-74 show a similar pattern with slightly less favorable numbers: NNV of approximately 900 in a matched season rising to around 1,800 in an H3N2 mismatch. The NNH/NNV ratio for anaphylaxis falls from about 694:1 to 347:1, which remains strongly favorable. For adults 50-64, the matched NNV of 2,800 rises to roughly 7,000 in a mismatch season, with the anaphylaxis ratio falling from 223:1 to 89:1. Still favorable, but the margin is narrowing.
The picture changes meaningfully for healthy adults aged 18-49. The matched-season NNV of roughly 8,000 rises to approximately 20,000 in a mismatched H3N2 year. [15] The anaphylaxis ratio falls from 78:1 to 31:1. That is not an argument that vaccination is harmful for this group; 31 hospitalizations prevented per anaphylaxis case is still a favorable ratio. But it is a ratio that deserves to be stated plainly rather than obscured in a population-level average that is dominated by older, higher-risk recipients.
For school-age children and adolescents, the matched-season NNV to prevent one hospitalization exceeds 18,000, rising to roughly 36,000 in a mismatch year. The NNH/NNV ratio falls to approximately 35:1 matched and 17:1 mismatched. Young children aged six months to four years present a distinct case: their hospitalization rates are higher than older children (NNV approximately 2,900 matched), but they also carry the febrile seizure risk that has now generated FDA-mandated label warnings.
These comparisons are based on the best currently available “official” data, but each of the data sources and analysis methods that underpin these data have biases and limitations as discussed below.
Table 3: NNV to prevent one death, by age and season type
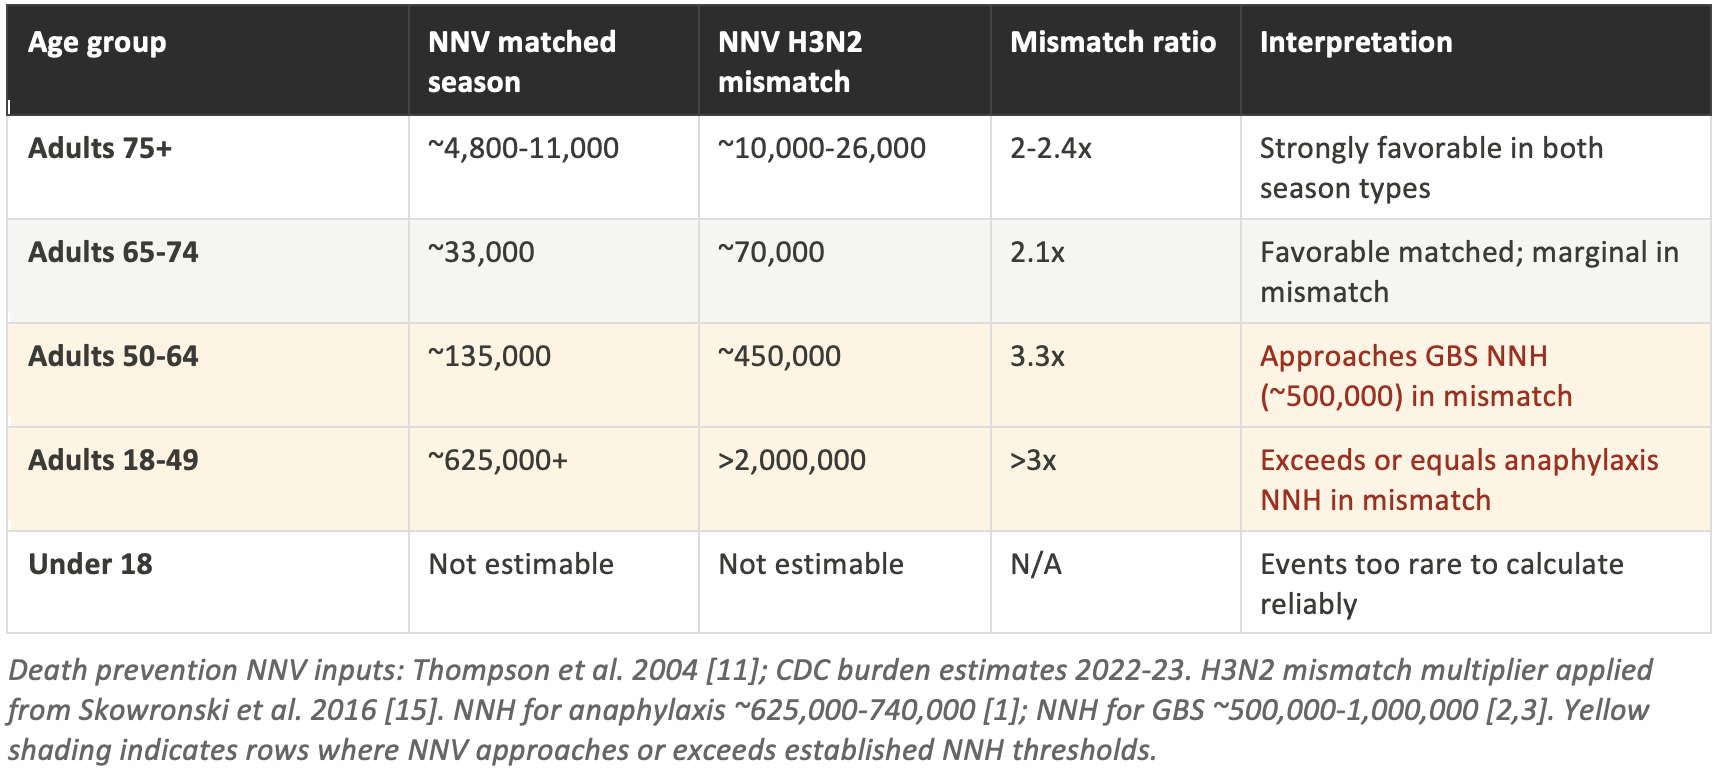
The death-prevention NNV analysis sharpens the age gradient considerably. For adults 75 and older, the NNV to prevent one death ranges from approximately 4,800 to 11,000 in a matched season, rising to 10,000 to 26,000 in an H3N2 mismatch. [11] In either scenario, this remains substantially below both the anaphylaxis NNH (~625,000) and the GBS NNH (~500,000). The mortality benefit in this age group is real and meaningful.
For adults 50-64, the matched-season NNV for death prevention is approximately 135,000. In a mismatched H3N2 season, it rises to around 450,000. That figure approaches the lower bound of the GBS NNH range (~500,000), meaning that in a severe mismatch year, the vaccine may prevent approximately one death per one GBS case caused in this age group. This is not a reason to avoid vaccination, but it is precisely the kind of nuance that a blanket universal mandate fails to capture.
For adults 18-49, the matched-season NNV for death prevention exceeds 625,000, equal to the lower bound of the anaphylaxis NNH. In a mismatched H3N2 season, it rises above 2,000,000. Put differently: in a poor H3N2 year, vaccinating more than two million healthy adults aged 18-49 would be expected to prevent approximately one death, while vaccinating 625,000 to 740,000 of those same adults would be expected to cause one case of anaphylaxis. The math no longer straightforwardly favors mass vaccination in this group during mismatch seasons.
H3N2 mismatch seasons: a closer look at the historical record
H3N2-dominated mismatched seasons are not rare edge cases. They represent the norm roughly one third of the time, and they have occurred in some of the highest-burden flu years on record. Understanding the specific mechanisms of H3N2 underperformance matters for assessing whether any given season is likely to fall into this category.
Table 4: Season-specific H3N2 VE and derived hospitalization NNV

The 2004-05 season is the most extreme case in the modern record. H3N2-specific vaccine effectiveness was approximately 10%, producing an NNV for hospitalization prevention in the 65-74 age group of roughly 3,780, compared to the reference NNV of about 900 in a matched season. For adults 18-49, the NNV reached approximately 33,600. At that level of effectiveness, the vaccine still prevents some hospitalizations, but the benefit per dose administered is substantially diminished.
The 2014-15 season is particularly instructive because it generated the most thoroughly documented interaction between vaccine mismatch and serial vaccination effects. Skowronski et al. documented that individuals vaccinated in the prior one to two years without an updated antigen showed near-zero or negative effectiveness, while first-time vaccinees retained modest protection. [15] The season-specific NNV for adults 65-74 of approximately 1,990 in that year masks this stratification: the NNV for serially vaccinated individuals was substantially worse, while first-time vaccinees experienced something closer to the matched-season estimate.
WHAT H3N2 SEASONALITY MEANS FOR INDIVIDUAL DECISIONS
In most years, knowing in advance whether a season will be H3N2-dominated and mismatched is not possible at the time vaccination decisions are made in September and October. The CDC typically issues initial VE estimates in January or February, after vaccination campaigns are already well underway. This is an inherent limitation of the annual vaccine model, not a failure of any particular decision-maker.
For high-risk groups (adults 75+, adults 65-74, immunocompromised individuals), the H3N2 mismatch scenario still produces a favorable NNV/NNH ratio. Currently available data supports the conclusion that vaccination is justified even without foreknowledge of season type.
For lower-risk groups (adults 18-49, school-age children), the season-type uncertainty matters more. In a matched season, the NNV/NNH ratios are clearly favorable. In a mismatched season, they narrow toward territory where individual clinical context becomes the determinative factor. A policy that mandates uniform vaccination for all adults without any mechanism for adjusting to seasonal conditions cannot make this distinction.
A note on the evidence: what these data sources cannot tell us
Any honest engagement with this analysis requires confronting the methodological limitations of the surveillance systems on which it rests. These limitations do not invalidate the findings, but they affect how confidently any specific number should be held, and in which direction the biases are likely to run.
Table 5: Summary of data source limitations
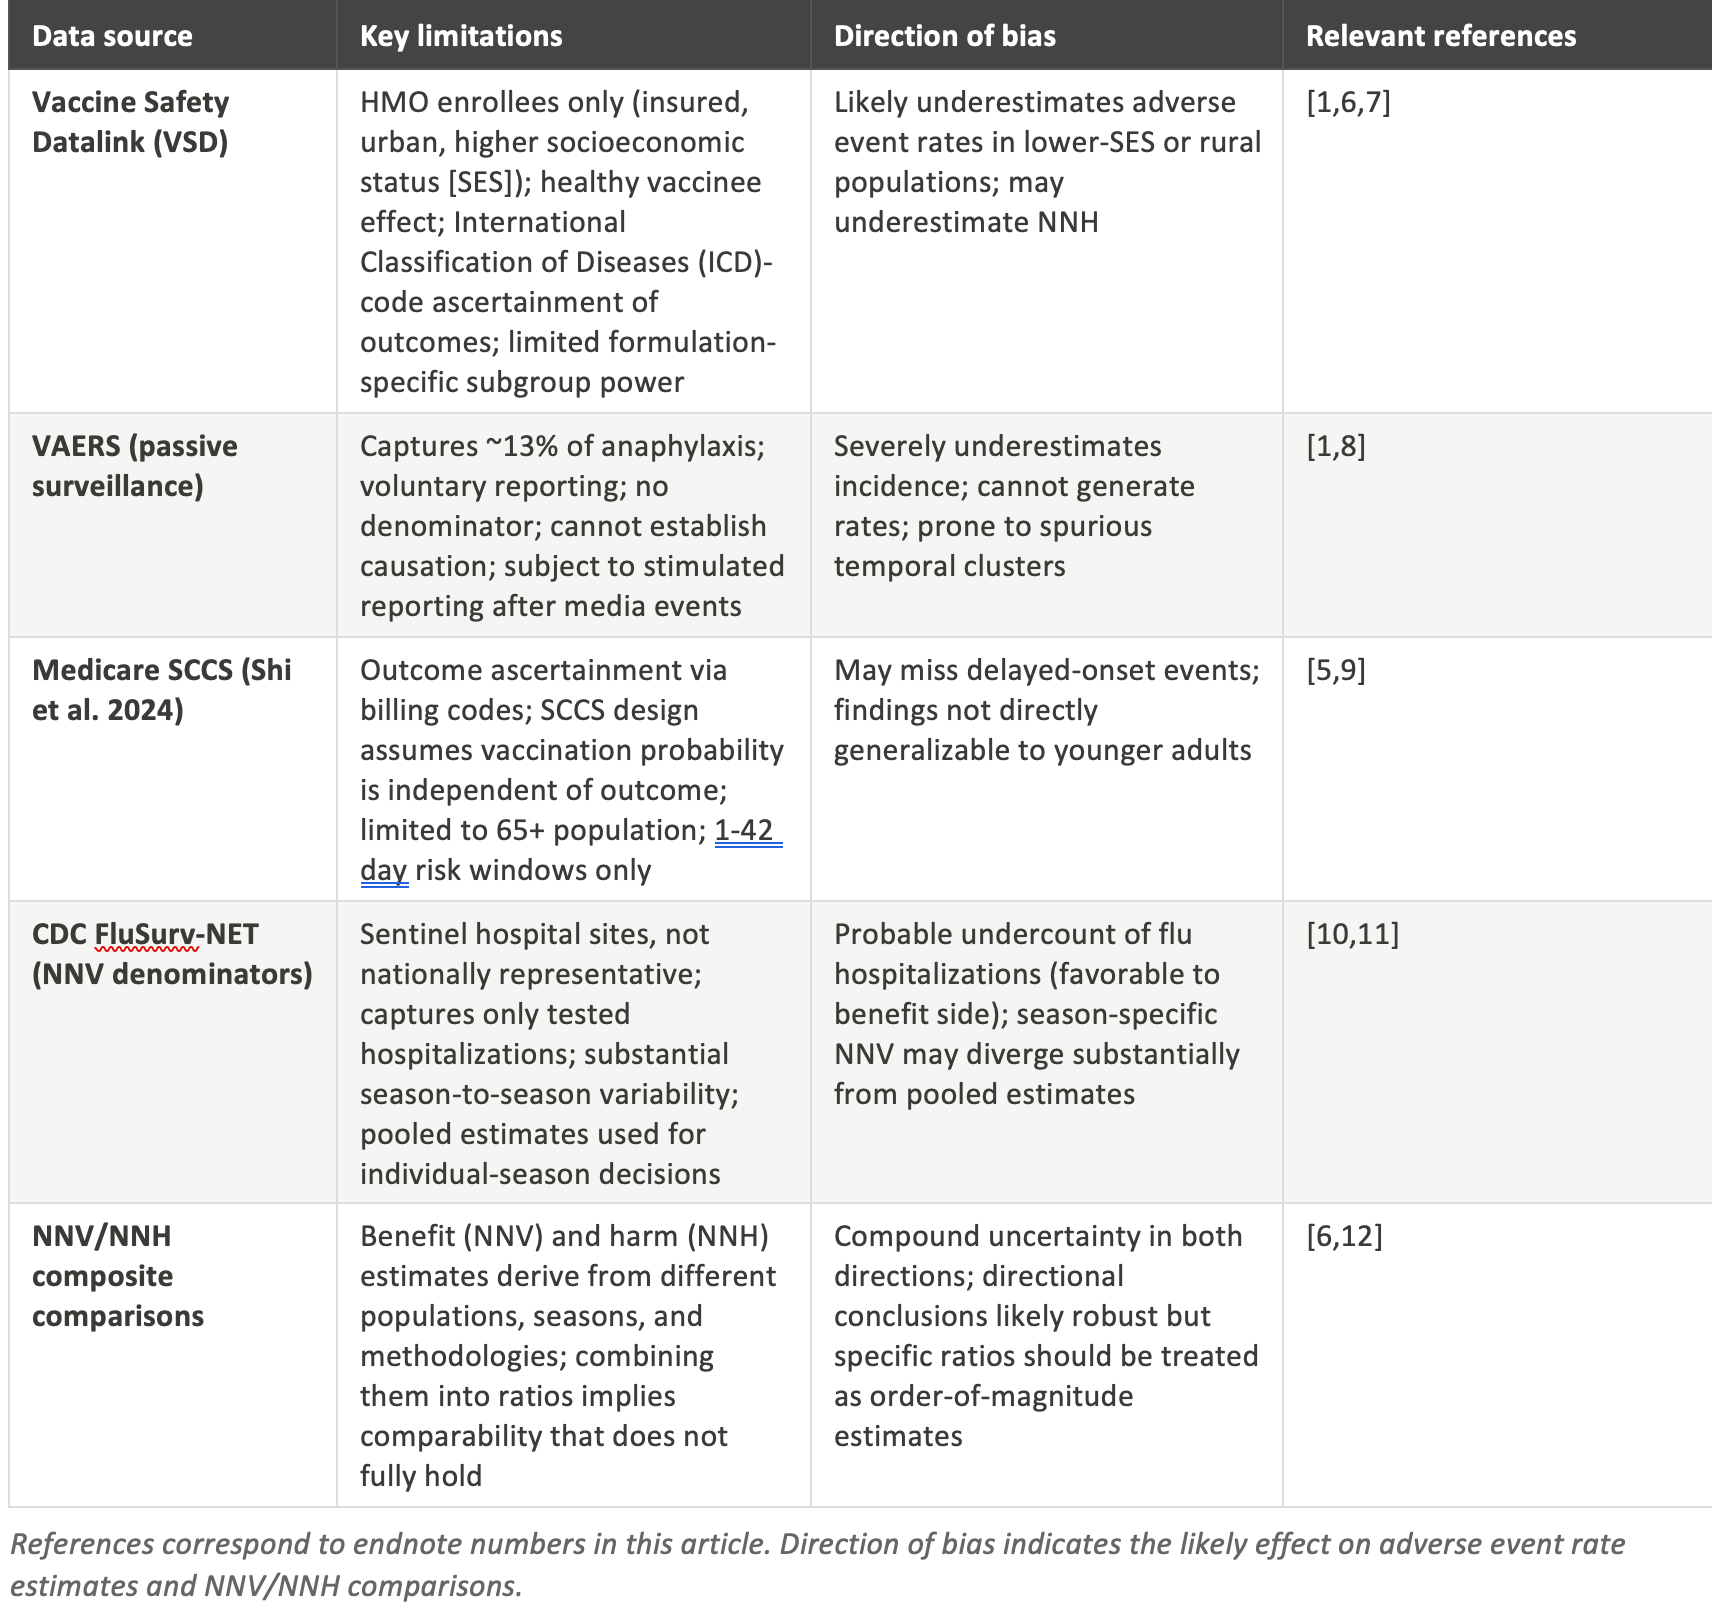
The Vaccine Safety Datalink, which is the foundation for the anaphylaxis and most of the GBS estimates, is the strongest source used in this analysis. It uses active surveillance, has a defined denominator, and links vaccination records to medical outcomes. But its enrollment base consists of members of large, integrated health maintenance organization (HMO)-type health systems (Kaiser Permanente, HealthPartners, and similar organizations) who are systematically more educated, more affluent, and more consistently engaged with the healthcare system than the general US population. [6] Additionally, the healthy vaccinee effect means that people who choose to get vaccinated are healthier than those who decline, even after covariate adjustment. Both of these factors likely cause the VSD to underestimate adverse event rates in less advantaged populations. [7]
VAERS, the voluntary passive reporting system, captures roughly 13% of anaphylaxis cases and even lower fractions of less dramatic events. [8] It cannot generate incidence rates without external denominator data, cannot establish causation from temporal association alone, and is subject to stimulated reporting surges following media attention. VAERS is useful for signal detection, but any analysis that uses raw VAERS counts to estimate incidence or to argue that a vaccine is dangerous should be treated with significant skepticism. This analysis relies on VAERS only to illustrate the underreporting problem, not to estimate rates.
The Medicare self-controlled case series (SCCS) analyses by Shi et al. are large and methodologically sophisticated, but the SCCS design rests on an assumption that the probability of vaccination is independent of the outcome being studied. [9] That assumption can be violated in both directions: sicker patients may avoid vaccination (creating apparent protection), while patients who experience an adverse event may be less likely to be vaccinated in subsequent years (creating apparent safety). The Medicare population is also inherently limited to adults over 65, and the null findings on neurological outcomes cannot be extrapolated to the very different immune systems, comorbidity profiles, and baseline event rates found in younger adults. [5]
FluSurv-NET (CDC Influenza Hospitalization Surveillance Network), which supplies the hospitalization rate denominators for the NNV calculations, is not a random national sample. It operates through sentinel sites at academic medical centers in selected counties. [10] The network captures only hospitalizations where influenza testing was performed and returned positive, which likely undercounts the true burden of flu-associated hospitalization. That undercounting, paradoxically, means the benefit side of the NNV calculation is probably conservative. The true NNV may be lower (more favorable) than the numbers reported here, particularly in high-severity seasons. [11]
Perhaps the most important limitation is one that is rarely articulated in either pro- or anti-vaccination discourse: the NNV and NNH estimates reported in this analysis are not derived from the same populations, the same seasons, or the same methodologies. Combining them into ratios implies a comparability that does not fully hold. The VSD HMO enrollee who appears in the anaphylaxis denominator is not the same person as the FluSurv-NET sentinel-county hospital patient who appears in the NNV numerator. [12] The directional conclusions of the NNV/NNH comparisons are almost certainly robust: vaccination in high-risk groups is strongly beneficial, and the ratio becomes less favorable as baseline risk declines. But the specific numbers carry compounded uncertainty from both sides of the calculation and should be treated as order-of-magnitude estimates rather than precise figures.
What the aggregate framing obscures
Federal vaccine safety communications consistently present flu vaccine adverse events under a single umbrella: safe, effective, serious events extremely rare. That framing is not inaccurate for the specific claim it makes. It is incomplete as a basis for individual decision-making or for evaluating policy.
1. Risk and benefit are not uniformly distributed
The current data indicate that the greatest benefit from flu vaccination accrues to adults over 75, where hospitalization and mortality rates are high enough to generate compelling NNV ratios even in mismatched seasons. It does not follow that the same ratio holds for healthy young adults or children, where the baseline risk of serious flu illness is substantially lower. Policies derived from aggregate population-level benefit estimates and applied universally may be making the right call for high-risk groups and a less clear call for low-risk ones.
2. Formulation matters for risk, not just benefit
High-dose and adjuvanted formulations recommended for adults over 65 produce meaningfully higher local reactogenicity than standard-dose vaccines. A patient who is told that the flu shot may cause a sore arm and then receives an adjuvanted formulation may experience a significantly more pronounced local reaction than that description would suggest. Informed consent requires formulation-specific information, not generic vaccine descriptions.
3. Co-administration context changes the pediatric risk profile
The elevated febrile seizure signal in young children is amplified when the flu vaccine is given simultaneously with PCV13 and DTaP. A child receiving only the flu vaccine in a given visit does not carry the same risk profile as one receiving three vaccines simultaneously. Current immunization schedule guidance does not always reflect this distinction, and parents are rarely counseled on the option of staggered administration.
4. The data sources carry known biases in specific directions
As detailed above, the VSD likely underestimates adverse event rates in lower-SES populations, FluSurv-NET likely underestimates hospitalization burden (making the NNV calculations conservative), and VAERS is not suitable for incidence estimation. A well-calibrated reading of the evidence requires awareness of where these biases push the estimates, not just confidence that the aggregate numbers are approximately right.
What this means and does not mean
None of the above constitutes an argument against flu vaccination for people at genuine risk of serious illness. For adults over 65, for immunocompromised individuals, for those with significant cardiopulmonary disease, and for household contacts of infants too young to be vaccinated, the evidence for net benefit remains strong across most seasons. Based on currently available data, the NNV-to-NNH ratio in these groups is compelling.
What it does constitute is an argument against treating vaccine policy as a single-answer question applied uniformly across the population. The risk profile of any medical intervention, including vaccination, is not a single number. It is a distribution that varies by age, health status, formulation, season type, and prior exposure history. Current policy communications do not reflect that complexity. Current informed consent practices, in many clinical settings, do not either.
A 625,000-to-1 NNH ratio for anaphylaxis sounds reassuring until you are told the NNV for hospitalization prevention in your age group is 20,000. The math still favors vaccination. But it no longer sounds like the question answers itself.
The people most likely to be skeptical of mandatory annual influenza vaccination are not, for the most part, skeptical because they believe the vaccines are dangerous in some absolute sense. They are skeptical because the official communications about risk and benefit do not feel honest to them. They sense that the aggregate framing papers over genuine heterogeneity in individual risk-benefit profiles, and the data suggest they are not wrong about that.
Meeting that skepticism with more honest quantification, including transparent acknowledgment of the limitations of the underlying surveillance data, would serve public health better than meeting it with dismissal. The case for vaccination in high-risk groups is strong enough to survive contact with the actual numbers.
The case against universal, mandatory vaccination policies on purely ethical grounds is robust.
However, even among advocates of such policies, the case for universal flu vaccination is considerably more complex and, on balance, not advisable. This is due in part to both the adverse event data and the methodological constraints on the epidemiological data itself.
References
1. McNeil MM, Weintraub ES, Duffy J, et al. Risk of anaphylaxis after vaccination in children and adults. J Allergy Clin Immunol. 2016;137(3):868-878.
2. Lasky T, Terracciano GJ, Magder L, et al. The Guillain-Barre syndrome and the 1992-1993 and 1993-1994 influenza vaccines. N Engl J Med. 1998;339(25):1797-1802.
3. Baxter R, Bakshi N, Fireman B, et al. Lack of association of Guillain-Barre syndrome with vaccinations. Clin Infect Dis. 2013;57(2):197-204.
4. Lloyd PC, et al. Safety surveillance of seasonal influenza vaccines, 2023-24 season: self-controlled case series analysis. Vaccine. 2025.
5. Shi X, Hanson KE, Lloyd PC, et al. Safety of influenza vaccines among Medicare beneficiaries, 2022-23 season. Vaccine. 2024;42(15):3486-3492.
6. Jacobsen SJ, Sy LS, Ackerson BK, et al. Influenza vaccine effectiveness in the Vaccine Safety Datalink: limitations of the test-negative design. Vaccine. 2019;37(32):4461-4467.
7. Jackson LA, Yu O, Belongia EA, et al. Frequency of medically attended adverse events following seasonal influenza vaccination. Pharmacoepidemiol Drug Saf. 2010;19(10):1010-1016.
8. Shimabukuro TT, Nguyen M, Martin D, DeStefano F. Safety monitoring in the Vaccine Adverse Event Reporting System (VAERS). Vaccine. 2015;33(36):4398-4405.
9. Farrington CP. Relative incidence estimation from case series for vaccine safety evaluation. Biometrics. 1995;51(1):228-235.
10. Chaves SS, Lynfield R, Cheek JE, et al. The US Influenza Hospitalization Surveillance Network. Emerg Infect Dis. 2015;21(9):1543-1550.
11. Thompson WW, Shay DK, Weintraub E, et al. Influenza-associated hospitalizations in the United States. JAMA. 2004;292(11):1333-1340.
12. Schmid P, Rauber D, Betsch C, et al. Barriers of influenza vaccination intention and behavior. PLoS One. 2017;12(1):e0170550.
13. Zhao Y, et al. Influenza vaccine effectiveness against hospitalization: systematic review and meta-analysis of 165 studies. Clin Microbiol Infect. 2025.
14. CDC FluSurv-NET hospitalization surveillance. MMWR Surveillance Summaries. 2024;73(SS-6).
15. Skowronski DM, Chambers C, Sabaiduc S, et al. A perfect storm: impact of genomic variation and serial vaccination on low vaccine effectiveness, 2014-2015. Clin Infect Dis. 2016;63(1):21-32.
16. CDC Influenza Vaccine Effectiveness Networks. Past seasons vaccine effectiveness estimates, 2004-2026. cdc.gov/flu-vaccines-work/php/effectiveness-studies/past-seasons-estimates.html.
This article summarizes published peer-reviewed safety surveillance data and reflects the state of the scientific literature as of March 2026. It does not constitute medical advice. Individual vaccination decisions should be made in consultation with a qualified healthcare provider.
Acknowledgements
The author acknowledges the ongoing contributions of the CDC Influenza Vaccine Effectiveness Networks and their academic collaborators, who have generated the surveillance data underlying this analysis. No funding specific to this review was received. The author formerly served as the vice chairperson of the CDC ACIP committee and chairperson of the influenza vaccine work group, but consequent to a recent court decision in the case of AAP vs HHS, no longer has any affiliation with the CDC or the ACIP and is unconstrained by federal FACA regulations and restrictions. The views expressed are those of the author alone, and do not reflect the opinions of the USG, HHS, CDC, or ACIP.
Conflict of Interest Statement
No conflicts of interest are reported.
I edited the conclusion of this essay, as I didn't think carefully enough about what I was writing, but was wrapped in thinking about the data, not about the fact that it might appear as though I was not opposed to mandatory vaccination.
The conclusion now reads:
"The case against universal, mandatory vaccination policies on purely ethical grounds is robust.
However, even among advocates of such policies, the case for universal flu vaccination is considerably more complex and, on balance, not advisable. This is due in part to both the adverse event data and the methodological constraints on the epidemiological data itself."
I don't agree that the case for universal mandatory vaccination is complicated. It is quite simple, in my opinion. Mandatory vaccination is NEVER acceptable. It is a violation of human rights, and this is corroborated by quite a few who have rendered opinions on this topic previously, including those responsible for the Nuremberg Code (1947), the Declaration of Helsinki (1964 and 2013), UNESCO (Universal Declaration on Bioethics and Human Rights, 2005), the World Medical Association (Declaration of Geneva, 1948, 2017 and International Code of Medical Ethics 1949, 2022) the International Criminal Court (Rome Statue 1998), and the International Covenant on Civil and Political rights (ICCPR, Article 7). Arguments to the contrary are often proffered by the state, but ethics-based investigators have found these arguments lacking in every case. This does not stop the poisoners from mongering their poisons.